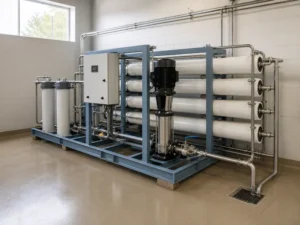
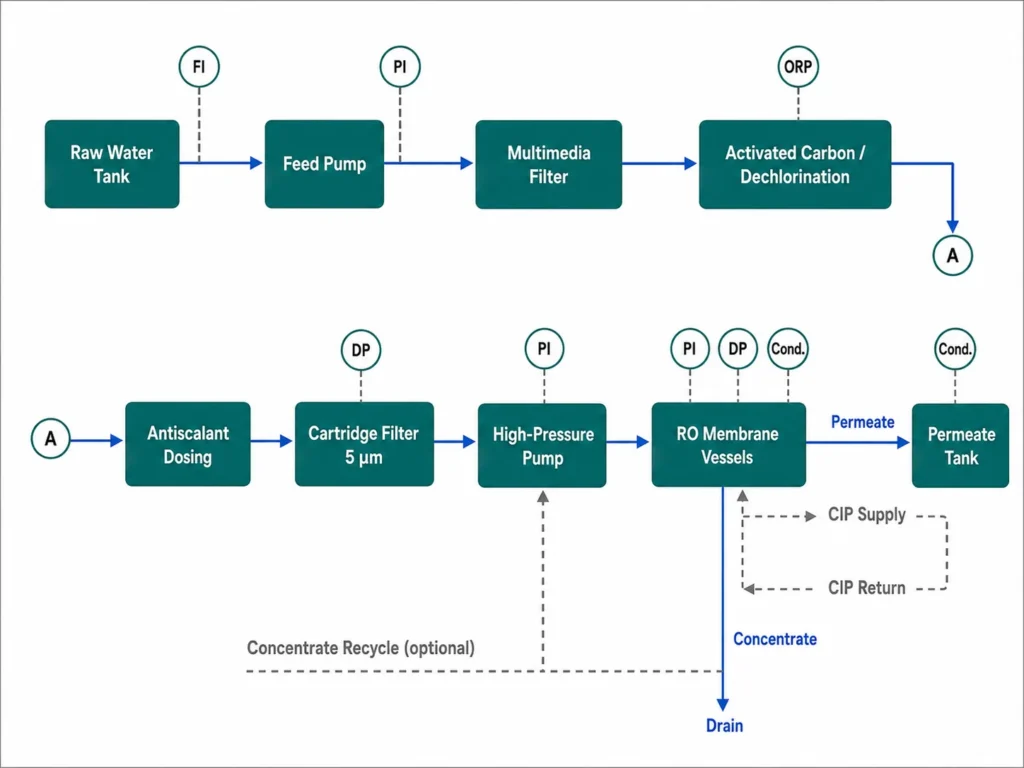
An industrial reverse osmosis system diagram maps the order in which feed water passes through pretreatment, high-pressure pumping, membrane vessels, and the permeate and concentrate outlets. Which blocks appear on a given drawing depends on the feed water analysis, the recovery target, and the required permeate quality.
Most diagrams published online are generic templates. Four blocks vary most between projects: the dechlorination stage, the softening or antiscalant dosing point, the concentrate recycle line, and post-treatment. Reading one well means asking two questions of every block. What water condition put it there, and what changes if it is missing.
| Parameter | Published orientation figure |
|---|---|
| Dissolved salt rejection, properly functioning system | About 95–99%, varying with membrane type, feed composition, temperature, pressure and system design |
| Recovery from a single stage | About 50% in typical industrial configurations |
| Membrane elements per pressure vessel | 6 or 7 in series, in common 8-inch industrial vessels |
| Stages needed to exceed 90% recovery | Four, as an arithmetic illustration at roughly 50% per stage |
| Design flux | Varies with source water and pretreatment; published rules of thumb run from single digits on seawater to the low twenties on RO permeate |
| Membrane cleaning | Triggered by normalised performance change rather than a calendar interval; one published threshold is a 15% shift from commissioning baseline |
Compiled from DuPont Water Solutions’ guidance on industrial RO system configurations for staging and vessel loading, and Puretec Industrial Water’s reverse osmosis primer for rejection, flux and cleaning thresholds. These are orientation figures, not design values. A standard test method defines how a measurement is taken. A supplier guideline recommends an operating envelope. A projection run on your own analysis produces the number you build to.
What an Industrial Reverse Osmosis System Diagram Actually Shows
An industrial reverse osmosis system diagram shows water-contacting equipment in sequence from intake to permeate storage, and its value depends on whether it was drawn from a measured water analysis or copied from a template.
Every version resolves to the same skeleton. A source, one or more pretreatment blocks, a high-pressure pump, pressure vessels holding membrane elements, and two outlet streams. The clean stream is permeate. The other is labelled concentrate, reject or brine, depending on who drew the sheet.
Tag letters carry as much information as the block shapes. FI and PI mark flow and pressure indication. DP marks differential pressure across a filter or a membrane stage. ORP marks oxidation-reduction potential downstream of dechlorination, and conductivity points sit on feed, permeate and often each stage. CIP supply and return lines usually appear as a separate loop tying into the vessel headers.
What the drawing excludes is defined too. ISO 10628-1:2014 specifies the classification, content and representation of flow diagrams for chemical and petrochemical plants. Three levels appear in practice. Many images returned by a search for an RO diagram sit at the coarsest of them.
| Diagram type | What it typically carries | What you can settle from it |
|---|---|---|
| Block flow diagram | Named process steps as boxes, with the main direction of flow | Whether a treatment step exists at all, and where it sits in the order |
| Process flow diagram | Major equipment, main streams and the principal operating conditions | Whether the configuration matches your feed analysis and recovery target |
| Piping and instrumentation diagram | Every line, valve, instrument and interlock, with sizes and materials | Whether the plant can be built, operated and isolated as drawn |
A supplier who has issued a flow diagram has not yet told you how the plant is plumbed. Valve selection, line sizing, material specification and interlock logic wait for the third row, and for the review that goes with it.
Why a Template Diagram Is Not a Design Basis
A template diagram describes a plausible arrangement of blocks, while a design basis fixes flow, recovery, flux and the water analysis that justifies each pretreatment step. ASTM D4195-23, the current guide for water analysis where reverse osmosis or nanofiltration is being considered, defines what that analysis should contain. The guide states that the analyses it covers determine the recovery at which a system can be safely operated, and that they help establish pretreatment requirements. A drawing without that dataset behind it is a sketch of somebody else’s project.
Sampling point is where this usually goes wrong. ASTM D4189-23, the current test method for silt density index, applies to relatively low-turbidity samples below roughly 1 NTU. The method also excludes the effluent of most RO and UF systems. A surface source above that turbidity needs turbidity, TSS and particulate analysis first. SDI then belongs after clarification or filtration, measured at the point representing the actual RO feed. An SDI figure attributed to raw surface water is reporting on a sample the method was written for a different case. It tells you little about what the pretreatment train has to achieve.
The same caution applies to design triggers. A commonly quoted rule places multimedia filtration in the drawing above an SDI of 3 or a turbidity of 0.2 NTU. Acceptable SDI targets published by membrane suppliers vary with source water and pretreatment type. Match the threshold on your drawing to your own supplier’s current guidance. Before we quote a system, we compare the customer’s analysis line by line against the blocks on the drawing, and flag any block that no result supports.
Reading the Flow Order: What Each Block Protects
Flow order on an RO diagram follows protection logic, so each block removes whatever would damage or foul the block downstream of it, and the sequence shifts when the method changes.
Pre-chlorination, where it appears, sits at the front because biological control is cheapest before anything has grown on filter media. Media filtration follows, taking out the particulate load that would otherwise reach the membrane surface. Dechlorination is required ahead of thin-film composite membranes, which have poor tolerance for chlorine and chloramines. A cartridge filter sits last in line before the high-pressure pump, commonly 5 µm nominal, though the membrane and skid supplier’s requirement governs.
Where the dechlorination block sits depends on the method, and drawings get argued over on this point more than any other. Designers normally place granular activated carbon upstream of the final cartridge filter, so that the cartridge captures carbon fines. Sodium bisulfite works differently. Its injection point may sit downstream of the cartridge filter, preserving an oxidant residual across the upstream filters. The reagent itself should be filtered before injection, with adequate mixing ahead of the monitoring point. Confirm the final location against the membrane supplier’s guidance, the mixing arrangement, and where ORP or residual chlorine is measured.
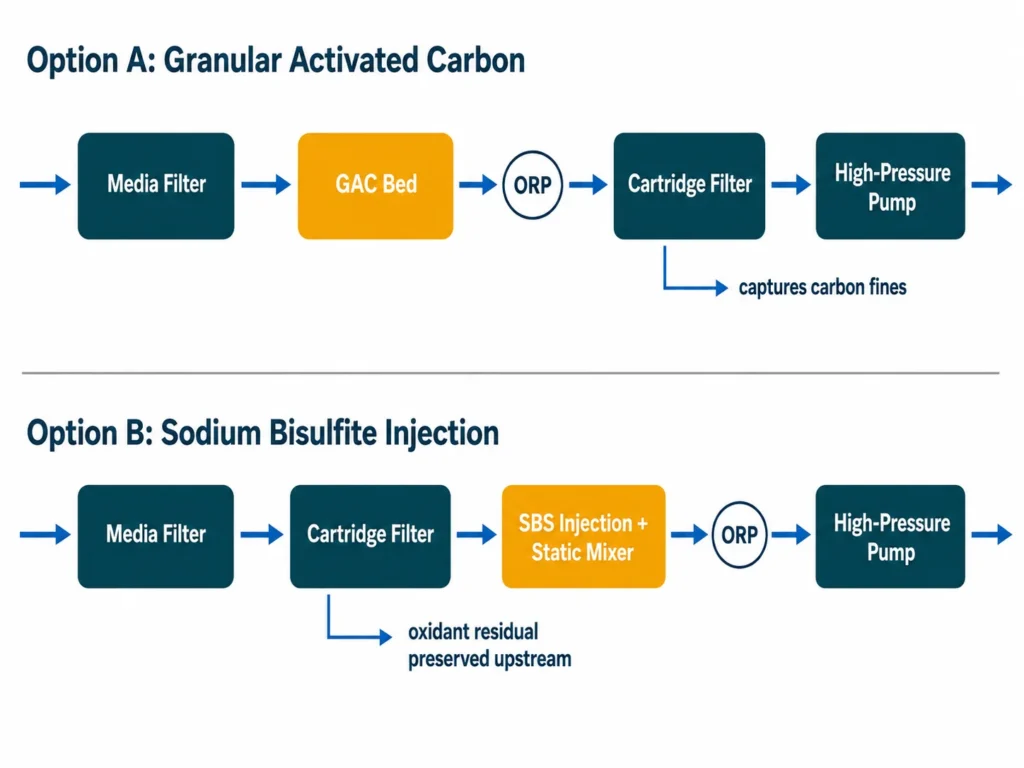
Carbon deserves separate thought, because it changes the nature of the risk instead of removing it. Once the disinfectant residual is stripped, everything downstream loses its biocidal protection. A carbon bed adsorbing organics can then become a growth site feeding the membranes. A cartridge filter behind the bed captures fines and released particulates, while the biological risk needs its own controls. Bed contact time and backwashing, sanitisation, short residence time for dechlorinated water, and monitoring of pressure drop or microbiological counts each carry part of that load.
On plants fed from open surface intakes, cartridge changeout interval is the cheapest early-warning instrument on the skid. A suddenly shorter interval usually reports on something upstream. Check media-filter breakthrough, coagulant carryover and carbon fines before treating the cartridge itself as the cause.
Which Blocks Are Conditional, and What Puts Them There
Conditional blocks on an industrial RO diagram appear according to measured feed water properties and the required permeate specification, independent of how large the system is.
| Block | What puts it on the drawing | What its absence usually means |
|---|---|---|
| Media or multimedia filter | Particulate load, judged by turbidity and TSS on raw water and by SDI at the RO feed point | Feed is already filtered upstream, or the template assumed a cleaner source than yours |
| Dechlorination (carbon, bisulfite, or both) | Any free chlorine or chloramine residual reaching the membranes | Source is unchlorinated; confirm by measurement, since source type alone is weak evidence |
| Softener or antiscalant dosing | Scaling potential at the design recovery, which is a different question from raw hardness | Recovery target stays low enough that solubility limits are not approached |
| Iron and manganese removal | Reduced iron or manganese in well water that oxidises on aeration | Source is surface water, or already oxidised and filtered |
| Concentrate recycle line | A recovery target above what the staging alone delivers | Target recovery is reached through stage count instead |
| Post-treatment (degassing, remineralisation, EDI or mixed bed) | End-use specification; undissociated dissolved CO₂ passes the membrane largely untouched, and its share depends on feed pH | Permeate as produced already meets the process specification |
One case makes the whole drawing unnecessary. If hardness is the contaminant actually blocking your process, softening alone may meet the specification, and no RO block belongs on the sheet. Membrane separation earns its capital cost and its concentrate stream only when the dissolved load requires it.
How the Recovery Target Redraws the Concentrate Side
Recovery target governs the right-hand half of the diagram, setting stage count, vessel array, and whether a concentrate recycle line appears at all. The reason is that concentrate concentration climbs steeply as recovery rises.
The staging arithmetic is simple. One stage typically reaches about 50% recovery in industrial configurations, so four stages illustrate what exceeding 90% takes at that rate. Each successive stage carries fewer vessels in parallel, which keeps enough cross flow across the later elements. Designers balance productivity between stages either by throttling permeate from the front stages or by boosting feed pressure into the later ones. That is why a second pump appears on some drawings and is absent from others.
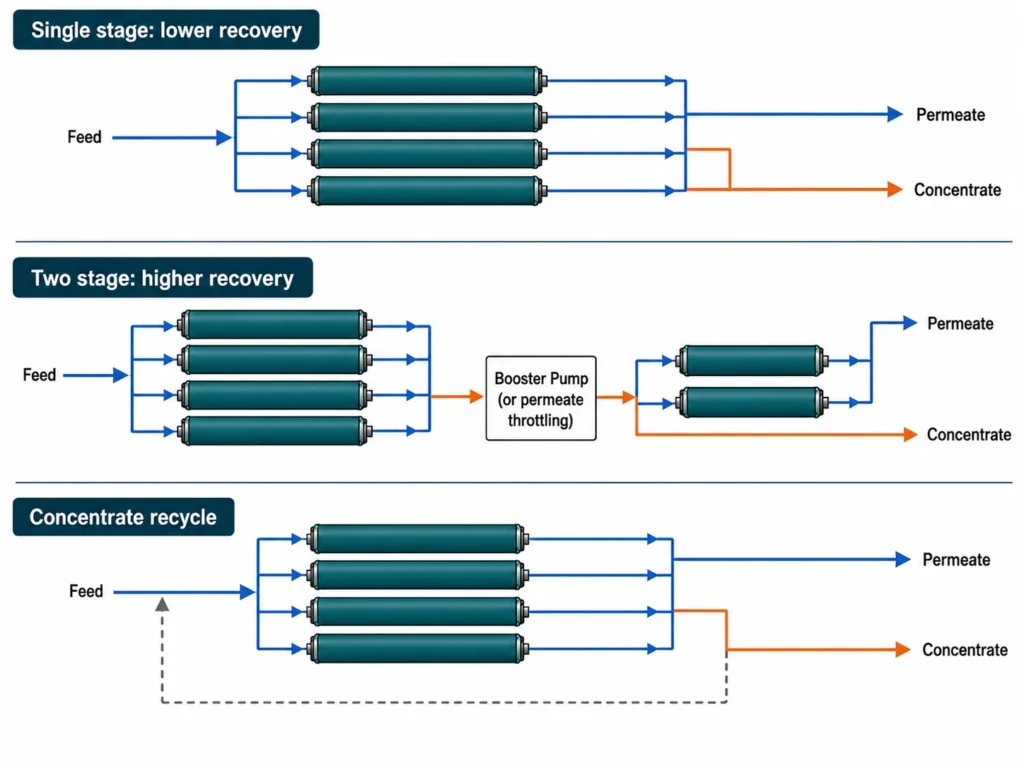
The concentration side can be worked out directly. Assuming complete salt rejection, and setting aside salt passage, chemical dosing and any recycle stream, the bulk concentrate concentration factor can be approximated as 1 ÷ (1 − recovery). At a 75% recovery target that gives about 4, so the concentrate line carries roughly four times the feed concentration. Push the target to 85% and the factor rises to about 6.7. The figure describes the bulk stream. Concentration at the membrane surface runs higher still, because of concentration polarisation. A ten-point move on a specification sheet therefore raises the dissolved load the last elements see by more than half again.
Antiscalant selection belongs to the recovery decision as much as to raw hardness. Two diagrams with identical block layouts and different recovery targets are not the same system.
Checking a Supplier’s Diagram Before You Approve It
Five checks turn a supplier’s RO diagram into something you can sign, and each one compares a block on the drawing against a line in your own water report.
- Match every pretreatment block to a specific analysis result, and ask what the block removes where no result supports it.
- Ask which recovery the staging was projected at, and whether the antiscalant was selected at that same recovery.
- Confirm the dechlorination method, its injection or bed position relative to the cartridge filter, and where ORP or residual oxidant is measured downstream of it.
- Check that SDI was measured at the RO feed point, and that raw-water turbidity and TSS were sampled in the worst season of the year.
- Verify the minimum monitoring set is drawn in: feed, permeate and concentrate flow, feed and permeate conductivity, stage differential pressure, temperature, and CIP tie-ins.
Why the Water Analysis Has to Exist Before the Diagram Does
An industrial reverse osmosis system diagram becomes a design basis once two inputs are settled: the water analysis and the recovery target. Both have to converge together. The analysis is locked first, because laboratory turnaround is the one lead time in the sequence that resists compression. Recovery follows it, since ASTM D4195-23 makes the point that safe operating recovery is itself a function of feed composition.
We verify free chlorine and ORP downstream of the dechlorination stage at commissioning, rather than treating the block on the drawing as evidence that it works. Seasonal turbidity, chloramine versus free chlorine, silica, and tank battery limits stay project-specific and need confirming against your own site data.
If your feed is chlorinated municipal water, be careful about what a packaged unit actually contains. Many commercial skids include only cartridge filtration, the high-pressure pump, vessels and basic instrumentation. Media filtration, softening and dechlorination arrive as external packages. Confirm the battery limits and included pretreatment of any commercial reverse osmosis water filter system before treating capacity as the last open variable. If your source is a surface intake with seasonal variation, start with a full analysis to ASTM D4195-23 taken in the worst month of the year. The pretreatment half of your diagram resists being drawn from an annual average.
FAQ
Vessel count follows membrane area, not output alone. Designers hold flux inside a range suited to the source water and its pretreatment. A dirtier source at the same permeate flow therefore needs more area, and more vessels to hold it.
The two do different jobs. A feed pump moves water through pretreatment and provides backwash flow for the media filters, while the high-pressure pump only builds the pressure the membranes need. Small skids sometimes combine the duties, and the drawing should say which arrangement applies.
Show the tie-in points at minimum. Normalised performance change triggers cleaning, not the calendar, so nobody knows the interval at drawing stage. Retrofitting connection points into an installed skid costs considerably more than including them now.
The tank often sits outside the supplier’s scope. Confirm which side of the battery limit it falls on before you compare quotations.
Yes, and the change runs deeper than one block. Chlorinated municipal feed adds dechlorination, and whether the residual is free chlorine or chloramine changes both the method and the contact time the drawing has to allow. Well sources more often add iron and manganese removal ahead of the media filter.
Related Posts
Brackish Water RO Design — takes the recovery and staging judgement above down to specific recovery limits and what to verify.
Industrial Reverse Osmosis System Components — covers the layer this article deliberately leaves out: how each block on the drawing is selected.
Reverse Osmosis System Problems in Industrial RO Plants — continues the oxidation and fouling symptoms this article uses to read a drawing.
Industrial Reverse Osmosis System Maintenance — turns the performance-triggered cleaning rule above into daily and weekly checks.
Types of Reverse Osmosis Systems — shows how the shape of the diagram itself changes across configurations.