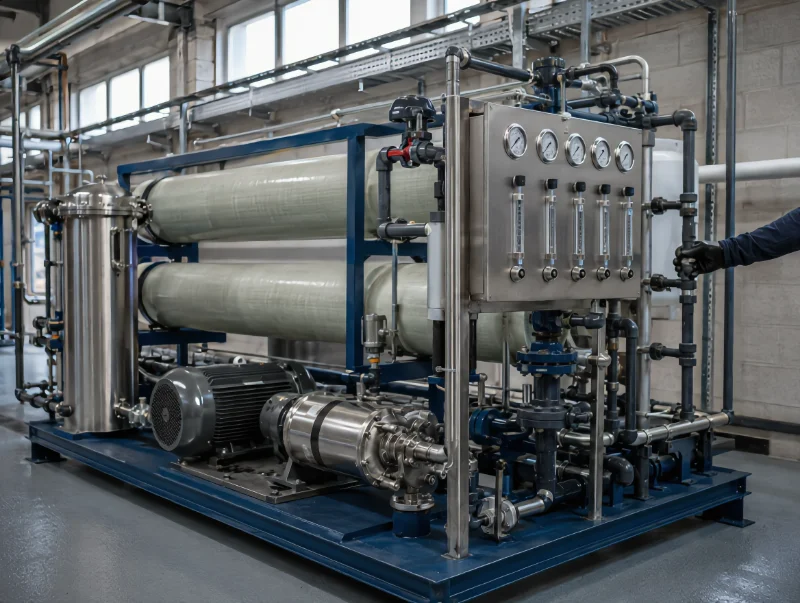
Industrial reverse osmosis system maintenance covers instrument calibration, consumable replacement, membrane cleaning, and performance trending. The interval for each is set by feedwater chemistry, recovery rate, and duty cycle, not by the calendar. Most maintenance decisions come down to reading three signals: normalized permeate flow, differential pressure across each stage, and salt passage. A current feedwater analysis and a valid acceptance-test baseline decide whether those readings mean anything. Without both, a program cleans too early, too late, or with the wrong chemistry, and the cost of each error lands on the membranes.
What an Industrial Reverse Osmosis System Maintenance Program Covers
An industrial reverse osmosis system maintenance program covers five subsystems, and how the effort splits among them is decided by source water and operating hours. Those reverse osmosis system components are pretreatment filtration, chemical dosing, the membrane array, the high-pressure pump set, and the instrumentation reporting on all four.
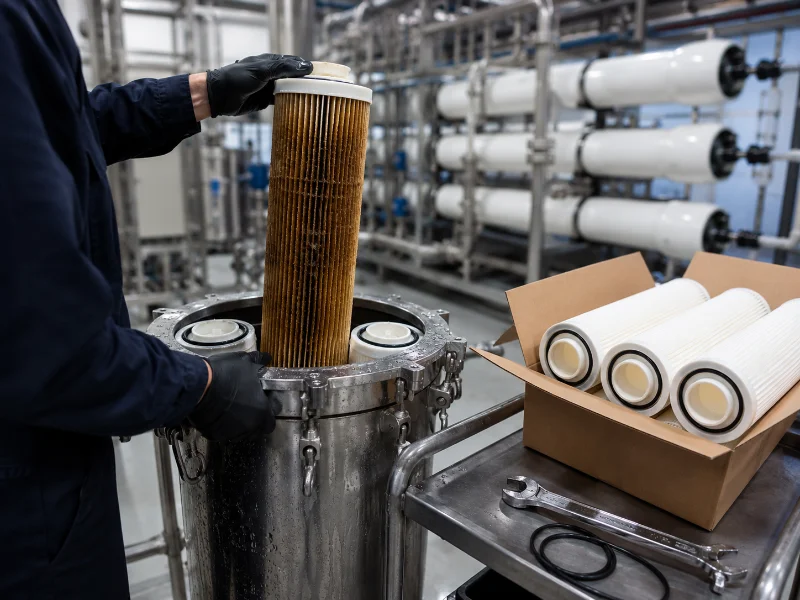
Pretreatment absorbs most of the routine labour on surface water, on well water carrying iron, or on any source that shifts seasonally. Its filters foul at a rate set by suspended solids load, not by a date on a schedule. Chemical dosing needs the opposite kind of attention. Antiscalant and dechlorination feeds rarely announce their own failure, so verify them by measuring the residual downstream of the injection point, not by confirming that the pump is running.
The membrane array is where maintenance stops being routine and becomes diagnostic, because cleaning is a chemical decision and the chemistry depends on identifying the foulant before the pump starts.
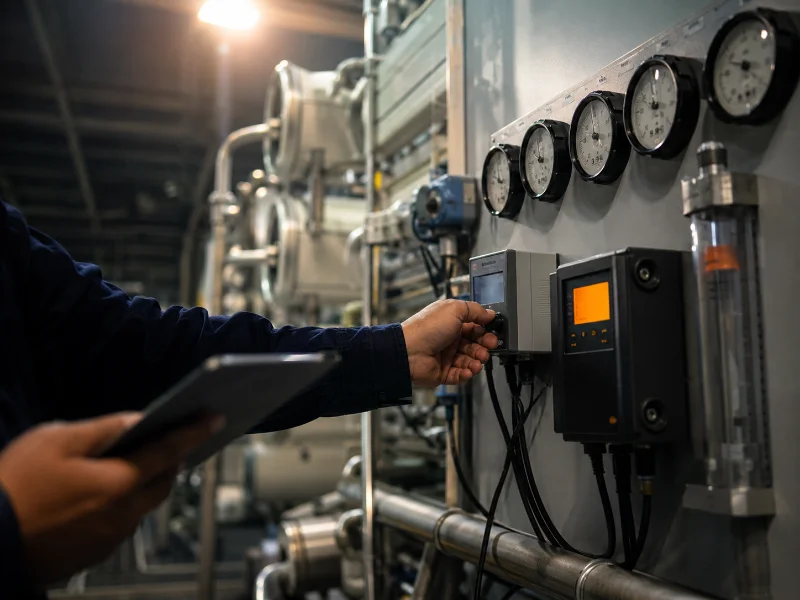
Calibration needs its own line. Conductivity cells drift, pressure gauges lose zero, and flow meters read low as impellers wear. Every threshold below rests on those readings, so an uncalibrated instrument does more than produce one wrong number; it invalidates the maintenance logic built on top of it.
Why Raw Flow Readings Mislead: Normalize Before Applying Any Threshold
Raw permeate flow readings from an industrial RO plant mislead operators in opposite directions across a single year, because flux responds to feedwater temperature, feed pressure, and salinity independently of anything happening to the membrane.
Water viscosity rises as temperature falls, so a colder feed produces less permeate through a perfectly clean element. Follow that through a seasonal cycle and one fixed rule produces two contradictory errors. In winter, falling temperature drags raw flow down toward the cleaning trigger while the membranes are still clean, and the plant cleans a system that did not need it. In summer, rising temperature lifts raw flow and masks membrane fouling that is developing, so the clean is deferred until deposits have consolidated and become harder to remove. Both errors shorten element life. Both are invisible if performance is logged as raw numbers. Membrane manufacturers make the same point in their own cleaning literature: a flux drop that follows a temperature drop is normal and is not evidence of fouling.
Normalization removes the ambiguity by correcting operating data back to a fixed reference condition. That is the function of ASTM D4516-19a, Standard Practice for Standardizing Reverse Osmosis Performance Data. Its scope is converting permeate flow and salt passage data taken at varying pressure, temperature, recovery, and feed concentration to a set of constant conditions, for spiral wound and hollow fiber systems alike. The same practice requires brine-staged systems to be standardized stage by stage, not as a single train, which is why a plant-wide pressure drop figure is close to useless for diagnosis.
Before we compare a plant’s operating data against any cleaning threshold, we align the readings to the conditions recorded during the acceptance test at commissioning. That baseline is worth guarding, and it is not the same thing as a baseline rebuilt later. A commissioning baseline records the system when it was clean and verified. A working baseline re-established after calibration, inspection, and a recovery clean is a usable reference for trending. What it cannot do is demonstrate that the plant ever met its original design or warranty performance, because whatever fouling was already present now sits inside the reference point.
On sites where the feed source switches seasonally, a river intake in the wet season and a well in the dry, the cartridge filter differential is normally the first reading to re-check after the changeover.
The Three Performance Signals That Decide When to Clean
Cleaning decisions on an industrial RO system rest on three normalized signals, and which signal moves first says more about the cause than how far any one of them has moved. Salt passage is the inverse of salt rejection, but it has to be normalized before comparison, not read off raw permeate conductivity.
| Signal | Typical cleaning trigger | What the movement points to | What to check first |
|---|---|---|---|
| Normalized permeate flow, falling | Drop of about 10% | General fouling distributed across the membrane surface | Feedwater SDI, pretreatment filter condition |
| Stage differential pressure, rising | Rise of about 10–15% | Feed channel plugging, most often front-end colloidal or biological material | Cartridge filter condition, biocide residual, first-stage vessel |
| Normalized salt passage, rising | Rise of about 5–10% | Tail-end scaling, oxidative damage, or a seal bypass | Recovery rate, antiscalant dose, chlorine residual history |
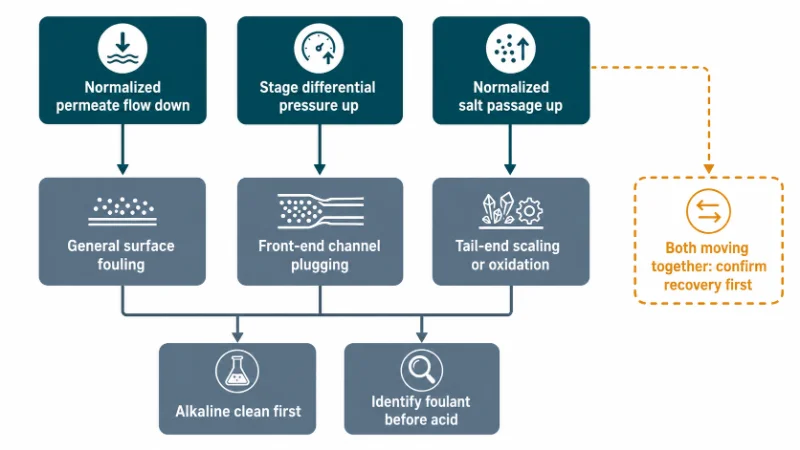
Location explains the difference. Differential pressure reflects hydraulic resistance in the feed channels; scale forms where concentration is highest, at the tail end; and oxidation changes the membrane’s selectivity without changing channel resistance at all. So differential pressure moving alone points toward channel plugging and an alkaline cleaning route, while salt passage moving with differential pressure flat points toward tail-end scaling or membrane damage. Where both deteriorate together, excessive recovery is one candidate, but so are compound fouling, a pretreatment failure, a feed composition change, a seal bypass, and flow or pressure control faults. These patterns narrow the investigation. They do not establish the root cause. Confirm actual recovery, stage-by-stage pressure drop, concentrate saturation calculations, chlorine history, and vessel-level permeate conductivity before committing to a chemistry.
On mixed deposits the default industrial reverse osmosis cleaning sequence runs alkaline first, then acid. Acid applied before organic, colloidal, and biological material has been removed can react with the mixed deposit and further reduce membrane performance. Acid first is justified only where the deposit has been confirmed as calcium carbonate or iron oxides and hydroxides.
DuPont’s cleaning guidance for FilmTec elements sets three separate triggers, not one. Clean when normalized permeate flow drops about 10%, when normalized salt passage rises about 5–10%, or when normalized pressure drop rises about 10–15%. Other suppliers set different limits, and the manual for the installed element is the controlling document.
What to Log, How Often, and What Actually Triggers Action
Logging frequency and action thresholds are two different schedules on an industrial RO plant, and how far apart they sit depends on feed variability. Confusing them produces both over-cleaning and missed damage. The frequencies below are planning defaults; the trigger column is what justifies intervention.
| Item | Typical logging frequency | What actually triggers action |
|---|---|---|
| Permeate flow, concentrate flow, recovery | Each shift or daily | Deviation from design recovery, or a trend break |
| Stage-by-stage differential pressure | Each shift or daily | Normalized pressure drop reaching the element supplier’s threshold |
| Feed and permeate conductivity, by vessel where fitted | Each shift or daily | Normalized salt passage rising past the supplier’s threshold |
| Free chlorine or ORP ahead of the membranes | Continuous, with daily confirmation | Any oxidant detected: investigate or interlock immediately |
| Cartridge filter differential pressure | Each shift or daily | Reaching the housing’s specified terminal differential |
| Instrument calibration | Per the instrument manufacturer’s procedure; quarterly verification as a planning baseline | Observed drift, repair, or an unexplained trend |
| Membrane cleaning (CIP) | Not scheduled by calendar | Normalized performance reaching the element supplier’s threshold |
| Full feedwater analysis | On source change, seasonal shift, or trend anomaly | Feed change affecting recovery limits or pretreatment adequacy |
Activated carbon is worth separating out, because its failure mode is silent. Carbon removes free chlorine mainly through surface-mediated reduction to chloride, not through simple physical adsorption. Dechlorination performance can then decline from surface exhaustion, organic fouling, biological growth, insufficient empty-bed contact time, or channeling. None of those necessarily raises bed differential pressure, which is governed by particulate capture instead. So the bed can pass chlorine downstream while its pressure drop still reads normal. Since polyamide thin-film composite membranes suffer oxidative damage that no cleaning cycle reverses, the only warning that arrives in time is a direct residual measurement at the carbon outlet. Online ORP works as an interlock and trend signal; a low-range free chlorine test is what confirms the membranes are seeing none.
Published figures for how long reverse osmosis filters last deserve the same treatment. Across the manufacturer and integrator guidance surveyed for this article, quoted service life for the same class of element spans roughly two to six years. The spread is that wide because element life is an output of feedwater conditions, recovery rate, and cleaning history. Write a published figure into a spare-parts budget without checking it against actual feedwater, and the usual outcome is elements failing ahead of the budget cycle with no replacement stock ordered.
Failure Patterns That Shorten Membrane Life
Most premature membrane failures in industrial RO plants trace back to four decisions, not to defective elements, and each has a verification step that would have caught it. The first is by far the most common.
| Decision | What it does to the membranes | The check that catches it |
|---|---|---|
| Running above design recovery | Concentrates the reject stream, which raises the tail-end saturation index and drives scaling whatever the antiscalant dose | Compare current recovery against the design figure in the commissioning documents, then confirm the antiscalant rate matches a current concentrate analysis |
| Changing feed source without a pretreatment review | A new well, a blended supply, or a seasonal turbidity peak can exceed what the existing pretreatment was designed to remove | Re-run the feedwater analysis and check it against the water the pretreatment was sized for |
| Operating without a recorded baseline | Leaves no reference condition, so no normalized threshold can be applied to any reading | Locate the acceptance-test data before the first clean, not after it |
| Cleaning before identifying the foulant | Wrong chemistry can consolidate a mixed deposit instead of removing it | Confirm the foulant from stage-level trends and concentrate chemistry before mixing solution |
Two variables outrank the rest: a current feedwater analysis, and a normalized baseline from the acceptance test. Both are one-way doors. A baseline never recorded at commissioning cannot be reconstructed from a system that is already fouled, and oxidative membrane damage from an unmonitored chlorine excursion is not reversible by any cleaning chemistry. Everything else can be settled afterward: cleaning chemistry once the foulant is identified, service frequency once trend data accumulates, and who performs the work at any point.
Not every installation justifies the full instrumentation set. A small, intermittently operated unit on stable municipal feed, with a working chlorine residual monitor, does not need normalization software, remote monitoring, or membrane autopsies. Those repay their cost where the system runs continuously, the feed varies, or an unplanned shutdown halts production. Clean it on normalized performance or the element supplier’s documented condition-based criteria, not automatically once a year. Before recommending the heavier program, we verify that the plant’s operating profile justifies it.
Where to Start with Industrial RO Maintenance
Two documents settle more maintenance questions than any schedule template: the commissioning acceptance test and a current feedwater analysis. This article covers the judgment layer of industrial reverse osmosis system maintenance, meaning which readings to trust and when they justify intervention. It does not cover CIP chemical concentrations, contact times, or temperature and pH limits, which belong to the cleaning guide for the specific membrane installed. Where a plant has no recorded baseline, expect the early trending period to be reference-building instead of diagnosis, and treat the resulting baseline as a working reference only.
Before quoting any interval, we clarify which of a plant’s readings are normalized and which are raw, because the two lead to different decisions from identical numbers.
Practical next steps, in order:
- Pull the element datasheet and commissioning report for the industrial RO machine on site, then locate the acceptance-test flow, pressure, and conductivity values.
- Confirm the last calibration date on the conductivity cells, pressure gauges, and permeate flow meter before trusting any current reading.
- Request a current, charge-balanced feedwater analysis covering the major cations and anions, alkalinity, pH, temperature, conductivity or TDS, silica, barium, strontium, iron, manganese, TOC, turbidity, SDI under stated test conditions, and residual oxidants, plus any source-specific contaminants where industrial wastewater is in the feed.
- Normalize recent operating data stage by stage against the acceptance-test conditions, then check each of the three signals against the installed element’s own thresholds.
- Verify free chlorine or ORP at the carbon bed outlet, independently of the bed’s differential pressure.
FAQ
Clean-in-place is standard for industrial arrays and keeps elements inside their vessels. Off-site cleaning is reserved for deposits that repeated CIP cycles fail to recover.
Stagnant water in a membrane array promotes biological growth, and biofilm established during an outage is harder to remove than fouling accumulated in service. Standard practice is to flush the system, then either recirculate on a set schedule or apply a preservative solution, with the choice depending on outage length and ambient temperature. Confirm the preservative against the element manufacturer’s compatibility list.
Seawater systems run at much higher feed pressure and lower recovery, which shifts maintenance emphasis toward high-pressure pumps, energy recovery devices, intake-related biofouling, and pretreatment stability. Scaling risk does not disappear, though. Scaling stays site-specific, and you evaluate it from concentrate chemistry and actual operating recovery.
Not a question of system size. Decide it on whether the site has staff who can interpret normalized trend data, CIP hardware sized for the array, chemical handling and spent-solution disposal capability, and the means to probe and sample individual vessels. Downtime cost and supplier warranty terms may decide it for you.
Related Posts
- How to Install an RO System — where the acceptance-test baseline this article depends on gets recorded in the first place
- Cartridge Filter Housing — the terminal differential that decides when the cartridge stage gets changed out
- Filter Cartridges & Water Treatment Media — what goes back into the housing, and how media choice shifts the fouling load reaching the membranes
- How to Remove a Reverse Osmosis System — isolation and element unloading, for the replacement end of the membrane-life question
- Top Industrial RO Manufacturers — supplier roles and code capability, behind the warranty terms that decide who services the plant