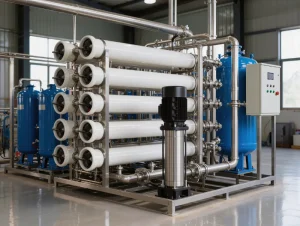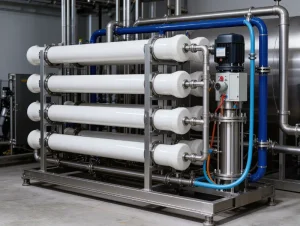
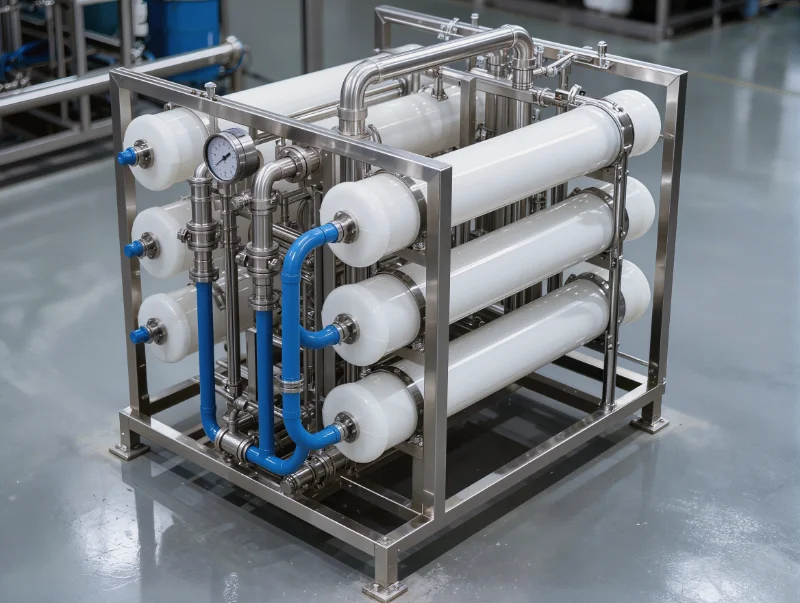
Most point-of-use reverse osmosis systems send five or more gallons of water to the drain for every gallon they purify. Inefficient units can reach ten to one. The exact figure moves with feed pressure, temperature, and the dissolved solids in the water. High-efficiency and WaterSense-certified models do better and cap the drain flow at 2.3 gallons per treated gallon. Staged industrial systems recover far more of their feed. The water going down the drain is not wasted by accident. It sweeps away the salts and contaminants the membrane blocks, which is what keeps the membrane working.
Why RO Systems Produce Reject Water
Reject water from an RO system is the concentrated stream that carries blocked contaminants off the membrane. How much a unit makes depends on the cross-flow its design keeps across that membrane. Inside the pressure vessel, pressure pushes feed water against a semi-permeable membrane. That is the heart of how reverse osmosis works. The part that passes through becomes clean permeate. The salts, metals, and particles left behind stay on the feed side. Something has to carry that rejected material away, or it builds up on the membrane and forms scale.
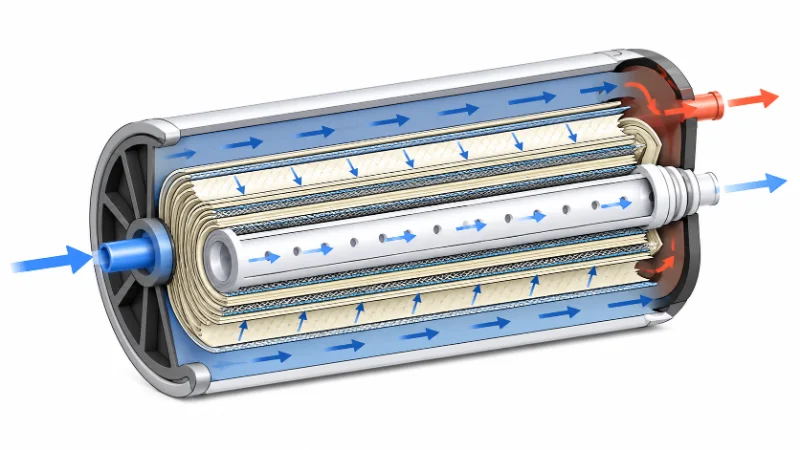
This is why the word “waste” is misleading. The drain flow is doing a job. It flushes the membrane surface so the system can keep separating water. A normal single-pass RO stage cannot run without it. So-called “zero-waste” systems do not remove that concentrate. They redirect it, reuse it, or send it to another process downstream.
In practice, there is a quick way to tell a wasteful unit from a normal one: check its feed conditions before its ratio. A system running below its rated pressure will read high on reject water, no matter how good the membrane is. So a high number usually gets explained at the pressure gauge, not the drain line.
Typical RO Reject-Water Ratios by System Type
RO reject-water ratios range widely, from about five-to-one on conventional under-sink units to well under one-to-one on staged industrial plants. The driver is recovery rate, which scales with the pressure, staging, and control a system can apply. Most homeowners meet the conventional point-of-use number first. The EPA’s WaterSense program says a typical unit sends five or more gallons to drain for every gallon of treated water. Some inefficient units reach ten to one. The University of Minnesota’s onsite-wastewater team puts it in engineering terms: many under-sink systems run at only 10 to 20 percent recovery. That works out to roughly four to nine gallons of concentrate per gallon of permeate.
| System type | Waste : treated (drain per gallon purified) | Approx. recovery | Why the ratio lands here |
|---|---|---|---|
| Conventional under-sink (tank) | ~4:1 to 5:1+ (inefficient up to 10:1) | ~10–20% | Low working pressure, simple flow restrictor |
| Efficient tankless point-of-use | advertised ~2:1 to 1:1 | ~33–50% (advertised) | Internal booster pump |
| WaterSense-certified point-of-use | 2.3:1 or better (EPA cap) | ≥30% | Regulated efficiency floor |
| Brackish-water industrial RO | ~0.3:1 or lower | ~75–85% | Higher pressure, staged arrays, antiscalant |
| Seawater industrial RO | ~1:1 to 1.5:1 | ~35–50% | High osmotic pressure caps recovery |
Waste:treated is gallons to drain per gallon of purified water. Recovery is the inverse: the share of feed that becomes product (about 30 percent recovery equals 2.3:1). Point-of-use figures are from EPA WaterSense and the University of Minnesota; industrial figures from AMTA. Advertised tankless and all industrial recoveries depend on feed pressure, temperature, and salinity, so confirm them against a unit’s rated test conditions.
The pattern across these types of reverse osmosis systems is consistent. Recovery rises with the pressure a system can hold and the controls it can apply. A compact under-sink unit has neither. That is why its ratio sits at the high-waste end, and no restrictor swap fully closes the gap. One point-of-use figure is regulated, not advertised. To carry the WaterSense label, a system must clear four bars. It has to be certified to NSF/ANSI 58, the U.S. standard for RO drinking-water systems’ materials, construction, and contaminant removal. It must also pass ASSE 1086, the RO water-efficiency standard. It needs to reach at least 30 percent efficiency, which is the 2.3-to-1 cap. And it must include an automatic shut-off device.
How to Estimate Your RO Wastewater Ratio
You can estimate an RO system’s wastewater ratio from two numbers: how much water it makes, and how much it sends to drain. Both connect through recovery rate, the share of feed water that becomes permeate. Two formulas link the figures:
- Recovery rate (%) = permeate volume ÷ feed volume × 100
- Waste-to-treated ratio = reject volume ÷ permeate volume
The two track together. At 30 percent recovery, the waste-to-treated ratio is about 2.3-to-1, the WaterSense floor. At 50 percent it is 1-to-1. At 80 percent, common for brackish-water industrial systems, it drops to about 0.25-to-1. That is four gallons of product for every gallon to drain.
To measure your own system, catch the drain flow and the product flow over the same interval. For a tank system, run it from an empty tank until the shut-off closes. Then divide drain volume by product volume. That gives your waste-to-treated ratio. A number much worse than the rating usually means low feed pressure, cold water, or a tiring membrane, not a broken system.
What Determines RO Water Waste
How much water an RO system wastes comes down to four things: feed pressure, water temperature, feed-water TDS, and membrane condition. Pressure and temperature matter most, because they decide whether the membrane can perform at all. If you can check only two things, check those two. Pressure is the force that drives water through the membrane. On many standard residential membranes, it needs to stay above about 35 to 40 psi. Below that, the membrane cannot hold its rated flux, so more of the feed leaves as reject. Industrial membranes run at much higher pressures, set by feed salinity and osmotic pressure. Temperature works the same way: cold water is thicker and moves through the membrane more slowly. That is why the same system wastes more in winter than in summer.
Both are upstream conditions. They change how every other factor reads, so nail them down before chasing the wrong cause. After those, feed-water TDS and membrane condition explain most of the rest. A higher dissolved-solids load raises the feed water’s osmotic pressure. At the same applied pressure, less water then crosses the membrane. On a home unit with a fixed flow restrictor, the drain flow stays about the same while permeate drops. So the ratio gets worse. High TDS also raises scaling risk, and that caps the recovery a system can safely hold. A fouling or aging membrane does the same, as does a clogged prefilter that starves the membrane of pressure.
This is why we confirm feed pressure and temperature for each source water before we commit to a recovery figure. The same membrane can post very different ratios at two sites. A number quoted without its conditions tells you little.
Why a 1:1 Ratio Isn’t Always Better
A 1-to-1 or “zero-waste” RO ratio is not automatically better. Forcing a low reject fraction onto a system not built for it trades water savings for two costs: faster membrane fouling and higher product-water TDS. When a home system is sold as “zero-waste,” the concentrate usually goes into the hot-water line or a storage tank instead of the drain. That saves water on paper, but it sends the rejected contaminants into the water you wash and cook with. It is a plumbing trade-off, not a filtration breakthrough.
Pushing a membrane toward 1-to-1 by just restricting the drain has a cost the marketing skips. With less water sweeping the surface, dissolved solids build up faster against the membrane. This is the kind of membrane fouling in high-pressure RO systems that speeds up scaling, shortens membrane life, and lets more salt slip into the permeate. Experienced RO users learn to watch for that rising product TDS. Reef-aquarium hobbyists, among the most demanding home users, report exactly this: tighten a standard membrane past its rated ratio, and you get quicker fouling and faster exhaustion of any polishing resin downstream.
The better question is which recovery a design can hold without hurting the water it makes. A good efficient system gets there by adding pressure and internal recirculation, not by choking the drain.
How to Reduce RO Wastewater Safely
Cutting RO wastewater safely comes down to two moves: raise working pressure, and reuse the concentrate. Both beat restricting the drain, because adding pressure improves the ratio without starving the membrane of its flushing flow. The most effective lever is pressure. Check that feed pressure sits in the membrane’s rated range. Where well or municipal supply runs low, a high-pressure booster pump raises recovery directly, because the membrane can then pass more of each gallon it receives. On tank systems, a non-electric permeate pump does similar work using energy already in the brine stream. Makers of these pumps report real cuts in drain water. The actual saving, though, depends on how the household draws water.
Maintenance keeps the ratio from drifting worse over time. A clogged prefilter drops pressure at the membrane, so changing sediment and carbon stages on schedule protects recovery as much as taste. The other route is reuse instead of reduction. Reject water can serve non-potable tasks such as irrigation, cleaning, or toilet flushing. First, though, check that its TDS, sodium, hardness, and any removed contaminants suit that use, and that local discharge rules allow it. Because the concentrate carries the rejected contaminants, it is not safe for drinking or cooking.
What does not work is pinching the drain line to force a lower number. That buys a better figure on paper, while concentrating solids against the membrane and shortening its life.
Why Industrial RO Recovers More Water
Industrial RO systems reach recoveries that compact home units cannot. They combine higher pressure, staged membrane arrays, and continuous concentrate management. Together, those recover most of the feed while still flushing each membrane enough. The gap is not about better membranes; the membrane chemistry is much the same. It is about what surrounds the membrane, and about the feed water itself. Plant-scale systems arrange membranes in stages. The concentrate from the first stage feeds a second array, and sometimes a third, so water rejected early gets another pass instead of going straight to drain. These systems hold higher, steadier pressure. They dose antiscalant so the concentrate can run more concentrated without scaling. And they watch conductivity in real time, pushing recovery close to the scaling point but not past it. On low-salinity feeds, brackish-water RO systems commonly reach 75 to 85 percent recovery, according to AMTA. Closed-circuit designs go higher still.
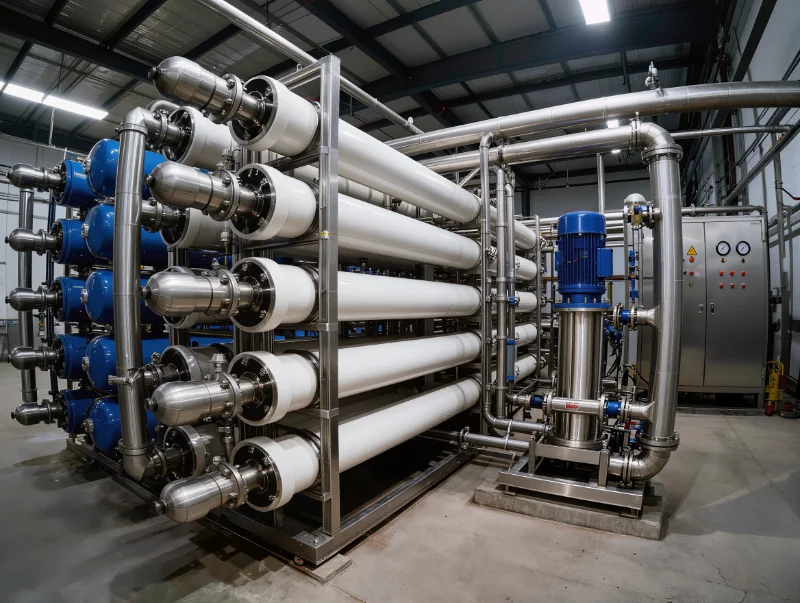
Seawater is the counterexample. Its osmotic pressure is so high that even a well-built seawater RO system usually recovers only 35 to 50 percent on a single pass. That is a physical ceiling, not an engineering shortfall. The same logic guides how we configure an industrial reverse osmosis water system. We match the recovery target to the feed-water salinity and the plant’s discharge limits, not to a headline number. A brackish feed and a seawater feed land at very different recoveries on the same hardware. That is why recovery is set per project, not advertised as a fixed ratio.
How to Vet a Low-Waste RO Claim
Two mistakes cost the most with RO water efficiency. The first is trusting a headline ratio without the conditions behind it. The second is fixing waste by choking the drain, which quietly costs you membrane life. Two checks handle most of this. Before you trust any low-waste number, confirm the feed pressure and temperature it was measured at, then the membrane’s age — in that order, because the first two decide whether the third can perform. A number measured at ideal pressure says little about a system running at 30 psi. And before you tighten your own system, make sure the gain comes from added pressure or recirculation, not a narrower restrictor.
Underneath the ratios, one idea does most of the work. Recovery rate is the real spec: it moves with pressure, temperature, and design, rather than sitting at a fixed value. A conventional under-sink unit almost always wastes more than a staged industrial system. Neither figure is a defect; each reflects what the design can hold. For a given source water and duty, we size the recovery target to the feed salinity and discharge limits, not to a marketing number. That is why the right ratio is a project-level answer, not a universal one.
If you are weighing RO for a facility rather than a kitchen, the recovery and reject volumes scale with it. It helps to see those trade-offs in a brackish-water RO project sized for a specific feed, where recovery, pressure, and membrane life get balanced at plant scale.
FAQ
RO reject water can harm plants, depending on how salty the concentrate is and what the membrane pulled out of your feed water. The reject stream is more concentrated than the feed, so its sodium, chloride, and minerals such as boron run higher than in tap water. Salt-sensitive plants, seedlings, and potted plants are most at risk, and clay soils hold that salt longer than sandy ones. Diluting the reject with fresh water, alternating it with normal watering, and keeping it off leaves all lower the risk. If your feed water carries arsenic, nitrate, or high sodium, keep the concentrate away from vegetable beds and test it before wider use.
A point-of-use RO system usually does not over-burden a working septic system. The University of Minnesota’s onsite-sewage specialists say a POU unit should not overload a septic system unless it malfunctions. Its concentrate is small next to a household’s total wastewater. The bigger concern is a whole-house, point-of-entry RO system. That treats and rejects far more water, and can add a load a septic field was never sized for. Either way, where the reject water should go is a separate onsite-wastewater engineering question. It depends on discharge volume, contaminant concentration, and local code, not on an RO unit’s spec sheet.
Yes, tankless RO systems usually waste less than tank models. They use an internal pump to hold higher membrane pressure, and they skip the slow tank-refill cycle that drives reject volume up. The edge is real but conditional. It still depends on good feed pressure and a sound membrane, and a neglected tankless unit can post a poor ratio anyway. The design lowers the floor for waste. It does not guarantee a low number on its own.
Check an RO system’s waste ratio whenever output slows or the drain flow climbs, and at least at every filter change. A clogging prefilter and an aging membrane both push the ratio up slowly, before other symptoms show. If the number jumps between checks, look first at feed pressure or a fouled membrane, not a failed unit.