Industrial reverse osmosis systems fail in a narrower set of ways than most operators expect. Each failure mode points to a specific variable, such as feed water chemistry, pretreatment adequacy, or mechanical wear, that determines the correct fix. This article covers RO system problems for skid-mounted and containerized industrial plants, including brackish water RO systems and other configurations treating surface or process water. It does not cover small under-sink or point-of-use residential units, whose failure patterns and repair procedures differ substantially.
Common Causes Behind Reverse Osmosis System Problems in Industrial Plants
Reverse osmosis system problems in industrial plants trace back to four recurring categories. These are membrane fouling and scaling, pressure or flow-related mechanical issues, permeate water quality deviations, and operational errors during startup or cleaning. Each category has its own diagnostic sequence. Treating all output problems as a “membrane replacement” issue is the single most expensive mistake plant operators make. A pressure vessel that shows falling permeate flow, for example, could be responding to fouling, a failing high-pressure pump, or simply colder feed water. Each of these three causes calls for a different corrective action and a different cost. We review incoming water quality reports against the original system design basis before recommending any component replacement. The root cause of a performance drop is rarely visible from the symptom alone.
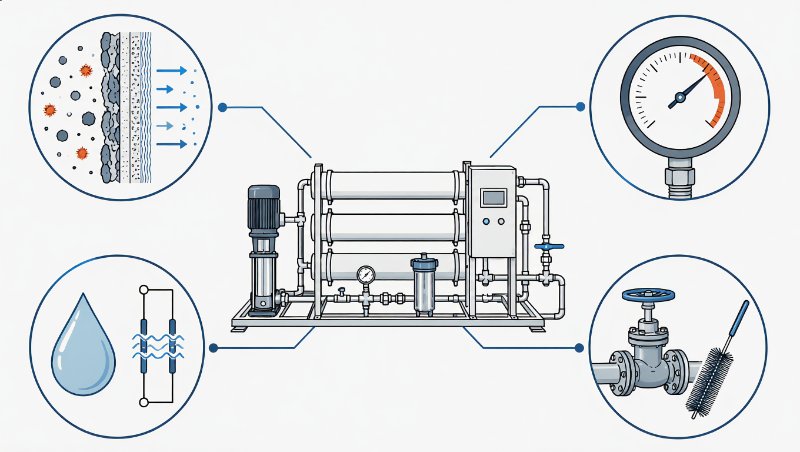
The sections below walk through each failure category in the order operators typically encounter them: performance loss, mechanical anomalies, water quality shifts, and procedural errors. Where a threshold or specification is mentioned, it depends on membrane type, feed water composition, and system design pressure. Figures from one plant do not transfer directly to another.
Why Declining Permeate Output Doesn’t Always Point to a Failed Membrane
Permeate flow decline in an industrial RO system depends on at least three independent variables: fouling layer thickness on the membrane surface, feed water temperature, and high-pressure pump condition. The same symptom, in other words, can have entirely different root causes at different plants. Operators frequently assume that falling output means a failing membrane. They order a replacement and skip the fouling and pressure checks that would have caught the real cause. A membrane that is fouled rather than failed typically recovers most of its original flux after a proper cleaning-in-place cycle. A mechanically compacted or oxidized membrane, by contrast, does not respond to cleaning at all. This distinction determines whether the correct next step is a chemical clean, a pump inspection, or a membrane autopsy.
In our engineering reviews, feed water temperature swings are one of the most consistently underestimated causes of apparent flow loss. When seasonal temperature changes go untracked, operators often assume the membrane is degrading and order a replacement. Later, flow often recovers on its own once feed temperatures rise, even though the membrane was never actually at fault. We verify temperature-corrected flow trends against the original commissioning baseline before recommending any membrane or pump replacement. Removing this variable is often enough to reveal the real cause.
Distinguishing a temporary dip from a developing fault is easier with normalized performance data, which multiple published membrane-cleaning references use to define common cleaning triggers.
| Normalized parameter | Commonly cited trigger range | What it typically signals |
|---|---|---|
| Permeate flow | Drops 10–15% from baseline | Fouling or scaling reducing effective membrane area |
| Salt passage | Rises 5–15% from baseline | Compaction, early fouling, or developing integrity loss |
| Pressure drop (ΔP) | Rises roughly 15% from baseline | Feed channel plugging from particulate or biological fouling |
These are widely published industry reference ranges, not membrane-specific specifications. The applicable trigger for a given system should be confirmed against the manufacturer’s normalization software and the original commissioning baseline.
When a flow reading looks abnormal, working through a fixed sequence avoids replacing the wrong component:
- Normalize the flow reading for feed temperature to rule out a seasonal effect
- Compare the normalized flow against the original commissioning baseline
- Check differential pressure across the array to see whether fouling is also raising ΔP
- Review recent feed water and pretreatment performance data for a source change
- If normalized flow and ΔP both point to fouling, schedule a CIP; if not, inspect the high-pressure pump
Fouling and Scaling as the Leading Driver of RO Performance Loss
Fouling and scaling in industrial RO membranes depend on source water composition, pretreatment design, and antiscalant dosing accuracy. Together, these three factors account for most performance complaints that reach a manufacturer’s technical support line. Fouling also carries a direct membrane fouling and energy consumption penalty, since a fouled membrane forces the high-pressure pump to work harder for the same output. Each fouling type leaves a distinct signature in the operating data. That signature might be rising feed pressure at constant flow, rising differential pressure across the lead elements, or declining salt rejection. The corrective action differs by type.
| Fouling type | Typical cause | Operating signature | Corrective action |
|---|---|---|---|
| Colloidal/particulate fouling | Inadequate pretreatment filtration | Rising differential pressure, lead-element flow decline | Improve prefiltration; verify SDI ahead of the RO |
| Biological fouling | Uncontrolled bacterial growth in feed water | Slow flow decline, odor at cleaning, biofilm on autopsy | Review disinfection program; add biocide or UV pretreatment |
| Inorganic scaling | Calcium, silica, or sulfate exceeding solubility limits | Declining rejection, scale visible on tail elements | Adjust antiscalant dose; verify recovery rate against feed hardness |
| Organic fouling | Natural organic matter or oil carryover | Pressure drop with little rejection change | Add upstream oil/organics removal; review coagulation performance |
Pretreatment adequacy for particulate and colloidal fouling is commonly checked with the Silt Density Index (SDI), a standardized filtration-time test defined in ASTM D4189. Feed SDI is typically expected to stay below 5 for spiral-wound elements and below 3 for hollow-fiber configurations. The applicable limit still depends on membrane type and the pretreatment already in place. An SDI reading above the design limit points to a pretreatment gap rather than a membrane defect. This should be corrected before using the fouling table above to diagnose the RO array itself.
We compare feed water analysis against the original system design basis whenever a plant reports unexplained fouling. A shift in source water is a more common trigger than equipment wear. That shift might be a new well, a seasonal turbidity spike, or an upstream process change. Cleaning-in-place chemistry and frequency should be adjusted to the fouling type identified during this review. They should not be applied on a fixed calendar schedule regardless of actual membrane condition. Cleaning also carries membrane-specific safety limits. Two common ones are a maximum pressure drop across the cleaning skid and a required flow direction that matches normal operation. Both limits exist to prevent mechanical damage during the clean itself. They should come from the membrane manufacturer’s cleaning manual rather than a generic in-house procedure.
Pressure and Flow Anomalies That Signal Equipment-Level Failure
Pressure and flow anomalies in industrial RO systems depend on high-pressure pump condition, valve and instrumentation calibration, and, in seawater systems, energy recovery device performance. These causes are mechanically distinct from the fouling-related problems covered above. A pump-side problem is best confirmed against several signals together: pump curve, motor amperage trend, discharge pressure, feed flow, and VFD speed. Rising amperage alone is not enough, since fouling, valve position, and instrumentation error can all produce a similar pattern.
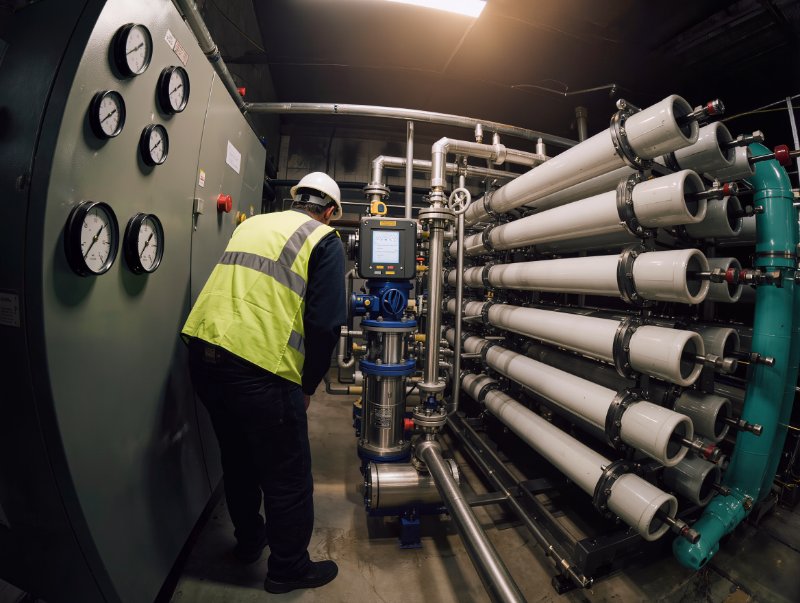
Energy recovery devices in seawater desalination systems introduce a third failure path. A worn or misaligned rotor reduces pressure exchange efficiency. This forces the high-pressure pump to work harder to maintain the same permeate output, inflating energy costs before any flow reduction becomes visible.
When plants report unexplained pressure fluctuations, we align the reported symptom against pump curve data and instrumentation calibration records before recommending a teardown. A miscalibrated pressure transmitter, after all, can produce the same alarm pattern as an actual mechanical fault. Valve actuator drift and check valve wear are common but easily overlooked contributors. This is particularly true in systems that have run for several years without a full instrumentation audit. This article does not cover pump repair procedures themselves, since the correct approach depends on pump type, drive configuration, and manufacturer specification.
Permeate Quality Deviations and Rising Salt Passage
Permeate quality deviations in industrial RO systems depend on RO membrane integrity, O-ring seal condition, and system recovery rate. They typically appear as a slow upward drift in conductivity rather than a sudden failure. A slow, steady rise in permeate TDS across all vessels usually points to membrane compaction or gradual fouling. A sharp rise isolated to one or two vessels, by contrast, more often indicates a mechanical breach.
Common culprits include a torn O-ring, a telescoped element, or a failed glue line. Distinguishing between these two patterns takes a vessel-by-vessel conductivity profile test. This avoids replacing an entire membrane bank when the actual fault is a handful of seals.
We verify permeate conductivity profiles vessel-by-vessel rather than relying only on the combined permeate reading. Averaging across vessels can mask a localized breach until salt passage becomes severe enough to affect the blended product water quality. Recovery rate set above the level the feed water and pretreatment can sustain is another frequent driver of quality deviation. Operating past the design recovery concentrates rejected salts and accelerates both scaling and osmotic pressure buildup at the tail elements.
Working through a quality deviation in a fixed order avoids replacing an entire membrane bank over a handful of failed seals:
- Confirm whether the rise appears in the combined permeate or only in certain vessels
- If it’s system-wide, check normalized salt passage against baseline and recent feed TDS
- If it’s isolated to specific vessels, run a vessel-by-vessel conductivity profile test
- Use the profile result to target the affected vessel for inspection rather than testing the whole bank
- Confirm whether an O-ring, glue line, or telescoping damage explains the localized reading before ordering elements
Operational Errors During Startup, CIP, and Preventive Maintenance
Operational errors during startup, shutdown, and cleaning-in-place cycles depend on procedure adherence, chemical dosing accuracy, and flush sequencing. They are responsible for a meaningful share of premature membrane replacements that have nothing to do with water chemistry. A well-configured CIP membrane cleaning system reduces this risk substantially. The most common errors we see during engineering reviews include:
- Starting the high-pressure pump before fully venting air from the pressure vessels, which causes hydraulic shock across the membrane elements
- Using CIP chemical concentrations or temperatures outside the membrane manufacturer’s specification, which can permanently damage the polyamide layer
- Skipping the low-pressure flush after a CIP cycle, leaving residual cleaning chemical in contact with the membrane at the next startup
- Restarting the system after an extended shutdown without a preservation or flush step, allowing biological growth to establish in stagnant feed lines
Each of these errors is preventable with a documented startup and CIP checklist reviewed against the membrane manufacturer’s specification. A generic procedure applied across different membrane types and system configurations will not catch them. We design startup and CIP procedures around the specific membrane model and feed water chemistry confirmed during system configuration. A procedure written for one membrane type can be actively harmful when applied to another.
Next Steps for Diagnosing and Correcting RO System Problems
Most reverse osmosis system problems trace back to one of four points covered here. Those are fouling or scaling, pressure or energy-recovery wear, a membrane integrity breach, or a startup and cleaning error. Isolating which category applies before ordering parts or scheduling a teardown avoids the most expensive mistake in RO troubleshooting. That mistake is replacing a component that was never actually at fault.
We review incoming water chemistry reports and application requirements against the original system design basis whenever a plant reports a performance issue. This is the same engineering process our team applies before confirming any new system configuration. Some corrective actions, including cleaning chemistry selection, recovery rate adjustment, and pretreatment upgrades, depend on site-specific water quality. They should be verified against a current water analysis rather than applied from a general guideline.
Is your plant seeing declining output, rising salt passage, or unexplained pressure trends? Our engineering team can help narrow down the likely cause before recommending a fix, and we do this for industrial RO systems across every source-water type. Sending a current water quality report and system data is the fastest way to start. The most useful starting data set includes:
- Feed water TDS, pH, and temperature
- Feed and concentrate pressure, plus stage-by-stage differential pressure
- Permeate conductivity, ideally by vessel rather than only the combined reading
- Current recovery rate and any recent SDI or turbidity readings
- Approximate time since the last cleaning-in-place cycle
Submitting this alongside a description of the operating symptoms is usually enough for our engineers to identify which category applies. From there, we can recommend next steps before any parts are ordered or a teardown is scheduled.
FAQ
Brand-new membranes rarely cause low output. The usual culprits are a cold feed water temperature, air left in the vessels at startup, or a high-pressure pump that is undersized for the design flow. Check those three before you suspect the membrane itself.
Actual flow is the raw number your meter shows, and it moves with feed temperature and pressure even on a healthy membrane. Normalized flow strips those variables out, so it tracks membrane condition alone. This matters because a plant watching only actual flow can mistake a normal winter dip for a failing membrane.
Calendar-based cleaning is the wrong trigger for most plants. A better signal is a normalized number crossing a set threshold, such as a drop in normalized flow or a rise in normalized pressure drop. Tie the clean to the data trend, and you avoid both over-cleaning and letting fouling harden.
Most early fouling is fixable. Biological, scaling, and organic fouling usually clear with the right cleaning chemistry and sequence. Physical damage is a different story. A compacted or oxidized membrane will not recover, and neither will a torn seal or a telescoped element. Those get replaced rather than cleaned.
A jump confined to a single train points to hardware, not water chemistry. A system-wide fouling or scaling problem would show up across every train at once. When only one train drifts, the likely cause is a torn O-ring, a damaged glue line, or a telescoped element in that train, which a vessel-by-vessel profile can pinpoint.
Higher recovery looks efficient, but it has a ceiling set by your feed water. Push recovery past what the pretreatment can support, and rejected salts concentrate at the tail elements. The result is faster scaling and a shorter membrane life. That is why we set recovery against a verified water analysis rather than chasing the highest number.