Yes, reverse osmosis can remove nanoplastics from drinking water when the membrane, seals, and downstream parts are intact. But no certification mark today guarantees nanoplastic removal for every RO system. The physics favor rejection. Nanoplastics measured in drinking-water studies are far larger than the transport pathways of a working RO layer, so an intact membrane blocks them by a wide margin. The harder question is whether a system keeps rejecting them as the membrane ages, fouls, or develops faults, and how an operator confirms that. This article sticks to membrane behavior and field verification. It does not cover the health effects of nanoplastics, which depend on dose and particle type and belong to health researchers.
What Nanoplastics Are, and Why Their Size Decides Membrane Behavior
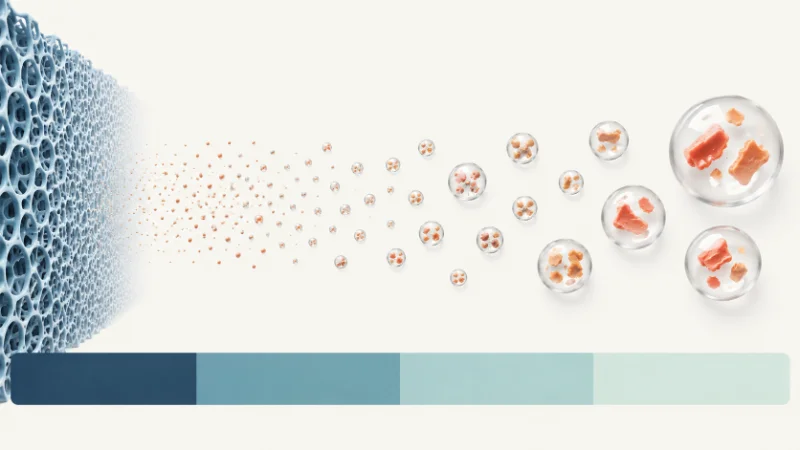
Nanoplastics are plastic fragments smaller than 1 micron, or 1,000 nanometers. That sets them apart from microplastics, which run from 1 micron up to 5 millimeters. The size gap matters because rejection behavior changes by orders of magnitude across that range. Most current data also sits at the upper edge of the nanoplastic scale. A 2024 study in the Proceedings of the National Academy of Sciences estimated about 240,000 plastic particles per liter in sampled bottled water. Roughly 90% were nanoplastics, and the quantified particles reached down to around 100 nanometers.
That detected range matters for membrane selection. For the nanoplastics reported in drinking-water studies, roughly 100 nanometers and above, the gap versus a working RO layer is large. So the decisive question is not theoretical size exclusion. It is membrane integrity, sealing, aging, and downstream recontamination, and that is where real-world results vary. Readers focused on the larger fraction can compare our breakdown of a reverse osmosis filter for microplastics, where the size scale changes the verification approach.
Does Reverse Osmosis Remove Nanoplastics? The Conditional Answer
Reverse osmosis rejects nanoplastics at high efficiency when the membrane and seals are intact, because the dense polyamide layer separates them rather than acting as a simple sieve. Some lab and product-specific reports show very high microplastic or nanoplastic reduction under defined test conditions. Those figures do not transfer to every system, though. They hold only for a checked particle size, membrane condition, recovery rate, and test method.
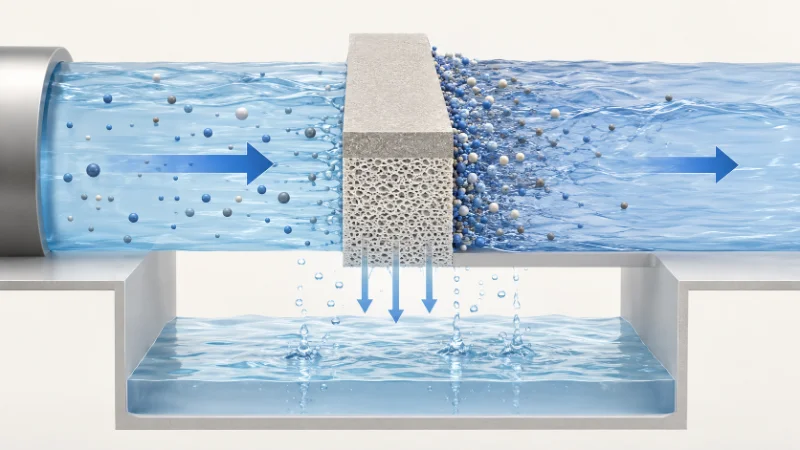
The mechanism corrects a common error. An RO membrane is often described as having a pore size around 0.0001 micron, or about 0.1 nanometer. That figure is marketing shorthand, not a literal claim of uniform open pores. A thin-film composite membrane is not a sieve. Water moves through the dense film by pressure-driven transport. The safer way to put it is this: particles in the measured nanoplastic range are far larger than the transport pathways of an intact layer. For the full mechanism, see how reverse osmosis works. Rejection depends on the barrier staying intact, not on whether a particle is “small enough to slip through.”
Why “0.0001-Micron Pores Block Everything” Oversimplifies the Answer
The pore-size talking point misleads in two opposite directions, and both errors send buyers to the wrong verification step. Read one way, “0.0001 micron blocks everything” implies removal is automatic and permanent. That ignores how polyamide membranes degrade. Read the other way, some coverage claims RO adds plastic to water. It points out that the main polymer found in that bottled-water study was polyamide, the same family used in many membranes.
Both claims need a correction. Polyamide membranes are vulnerable to oxidation. Exposure to free chlorine without proper pre-treatment is one of the first things that degrades rejection. So an aging or chemically damaged membrane is among the first parts an operator should re-check when removal looks suspect. The membrane-as-source claim needs care too. A published technical response to that study noted its procedural blanks showed contamination. The apparent polyamide signal may partly reflect lab artifacts, not proof that membranes shed nanoplastics into product water. Current evidence does not support treating a well-maintained RO membrane as a routine nanoplastic source. Even so, membranes, housings, tubing, and post-filters still belong in a full system-level check, especially after aging, oxidation, fouling, or poor maintenance.
How RO Compares With Ultrafiltration, Nanofiltration, and Carbon
RO is the strongest of the common membrane and media options for nanoplastic rejection, but the right choice depends on two things: whether you also need dissolved-solids removal, and how much pressure and reject water the application can absorb. The table below sums up the trade-offs that drive a real selection decision. Our guide to MF, UF, NF, and RO compared covers the same four methods in more depth.
| Method | Approx. separation scale | Nanoplastic relevance | Main trade-off |
|---|---|---|---|
| Reverse osmosis | Commonly described as ~0.0001 µm; technically a dense selective layer | Strongest option when membrane and seals are intact | Higher pressure, reject water, removes minerals |
| Nanofiltration | ~0.001–0.01 µm depending on membrane | May reject larger nanoplastics; smallest particles need test data | Passes more monovalent ions than RO |
| Ultrafiltration | ~0.01–0.1 µm | Useful for larger particles; uncertain for the smallest nanoplastics | Does not remove dissolved salts |
| Carbon block | Submicron to micron, product-dependent | Not reliable alone for nanoplastics | Good pre/post-treatment, not a standalone barrier |
In practice, carbon-only setups are not a nanoplastic solution. Ultrafiltration narrows the gap but leaves the smallest fragments uncertain. RO covers the reported drinking-water nanoplastic range, as long as dissolved-solids removal is acceptable for the use case.
What Determines Whether a System Actually Rejects Nanoplastics
Rejection in service depends on integrity factors that a spec sheet rarely captures: membrane condition, age and oxidation exposure, fouling and scaling, and post-membrane recontamination. A pinhole, a failed glue line, or a worn O-ring lets feed water bypass the barrier. An oxidized RO membrane loses rejection. A fouled membrane raises pressure demand. And storage tanks, tubing, or post-filters can reintroduce particles after the membrane has done its job. Each condition points to a specific check, not a fixed assumption. That is why verification, not the pore-size number, is the real measure of whether a system still performs at its rating.
How to Verify Nanoplastic Rejection Through Certification and Testing
Verification rests on rejection evidence at the relevant particle size, because no certification today names “nanoplastics” as a dedicated reduction claim. NSF/ANSI 58 is the performance standard for residential RO systems. It covers materials safety, structural integrity, TDS reduction, efficiency, recovery, and contaminant reduction. NSF/ANSI 401 can support a microplastics-reduction claim. But its method tests particles in the 0.5-to-1-micron range and requires an 85% reduction, so it stops above the nanoplastic scale. A microplastics claim should not stand in for a nanoplastics claim, unless the tested size range and method clearly support it.
For consumer systems, the usable path is a third-party lab report. Ask for the particle-size distribution tested, the method, and the measured percent reduction. Then confirm that the smallest tested size approaches the nanoplastic range. Industrial RO follows the same logic at a larger scale, but the validation should read like an engineering document, not a label. The items below separate a system that performs at its rating from one that underperforms:
| Validation item | Why it matters |
|---|---|
| Feed and permeate particle-size distribution | Confirms whether tested particles approach the nanoplastic range |
| TDS / conductivity rejection trend | Routine proxy for membrane integrity, not direct nanoplastic proof |
| Normalized permeate flow | Detects fouling or membrane compaction |
| Differential pressure | Flags scaling and fouling risk early |
| Free chlorine / ORP before RO | Protects the polyamide membrane from oxidation; handled by activated carbon pre-treatment |
| O-ring and pressure-vessel inspection | Prevents bypass leakage past the membrane |
| Point-of-use sample | Checks downstream tank, tubing, and post-filter recontamination |
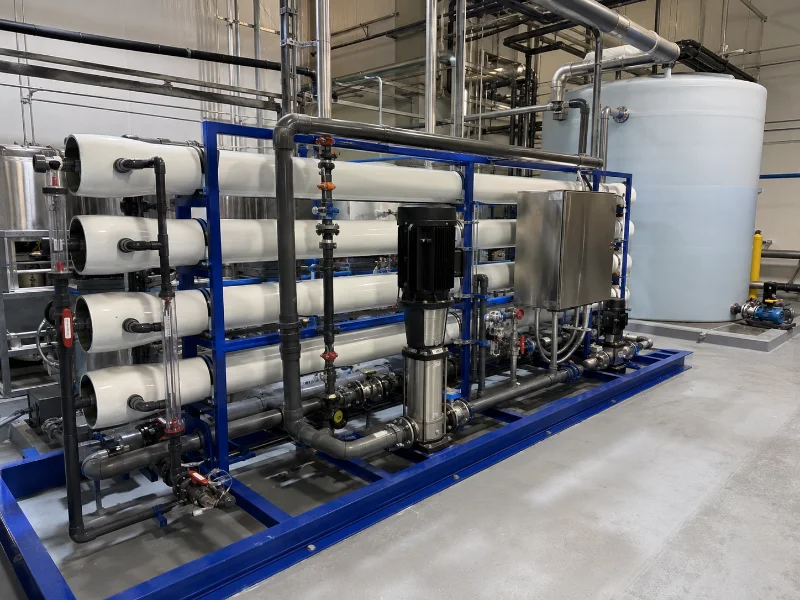
One distinction matters in practice. A TDS or conductivity trend is a fast integrity proxy, not direct proof of nanoplastic rejection. Only feed-versus-permeate particle data at the relevant size confirms that claim.
The Bottom Line on RO and Nanoplastics
Three variables decide the outcome: membrane integrity, separation scale, and verification. Membrane behavior settles the headline question. The nanoplastics reported in drinking-water studies are far larger than what a working RO barrier passes. What decides the result in the field is whether that barrier stays intact as it ages, fouls, and runs.
In our work building and validating RO systems, the failure pattern we see most often is not a membrane that “can’t” reject nanoplastics. It is a system trusted on its original spec long after oxidation or an integrity fault has cut its rejection, with no permeate testing in place to catch it. That is why we treat feed-versus-permeate validation under real operating conditions, not a pore-size number, as the standard of proof for any industrial ro water system we deliver. How well a system holds up depends on the feed chemistry, recovery rate, and maintenance regime, all confirmed per project.
For teams weighing RO for nanoplastic-sensitive applications, the next step is concrete. Gather the membrane’s particle-size rejection data. Define a permeate-monitoring routine before commissioning. And request a validation plan tied to your actual feed water. We are glad to review your feed-water profile and rejection targets and advise on a verification approach.
FAQ
No NSF mark proves nanoplastic removal today. NSF/ANSI 58 certifies overall RO performance, and NSF/ANSI 401 covers microplastics, but neither is tested across the full nanoplastic range. Use the mark as a baseline, then ask the manufacturer for particle-size rejection data at the smaller sizes.
No. Nanoplastics are smaller than 1 micron, while microplastics start at 1 micron. A filter proven for microplastics has not necessarily been tested at the smaller nanoplastic sizes, so a microplastics claim does not automatically cover nanoplastics.
Yes. A pinhole, an oxidized film, or a failed seal creates a bypass, and feed water can then carry nanoplastics into the permeate. This is why routine integrity checks matter more than the membrane’s original spec sheet.
No. TDS and conductivity readings track membrane integrity, not particle rejection at a set size. Keep them as a routine health check, but confirm nanoplastic rejection with feed-versus-permeate particle-size testing.
Test both. The membrane outlet confirms the membrane is rejecting particles. The point of use catches recontamination from downstream tanks, tubing, and post-filters. Checking only at the membrane misses faults that appear after it.