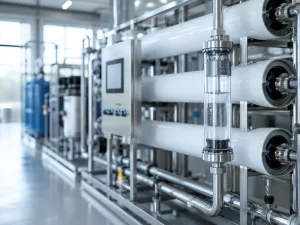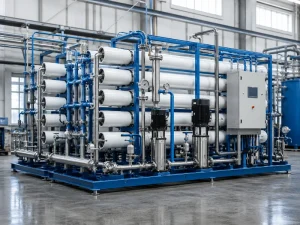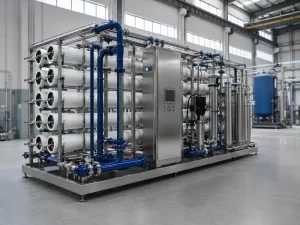
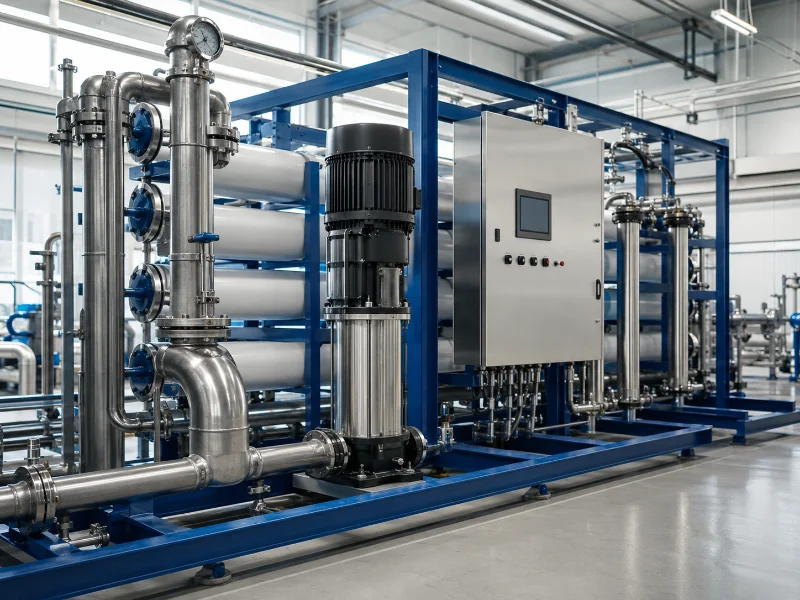
Energy is one of the largest ongoing operating costs in most high-pressure reverse osmosis (RO) systems. Membrane fouling is the factor that quietly drives it up. As foulants build on the membrane surface, the system needs more feed pressure to hold the same permeate flow, and more pressure means more power. We are the manufacturer of the systems we supply, so we check this fouling-to-energy link against each project’s source water before we confirm a design. The same equipment can run cheaply on one feed and expensively on another.
The Link Between Membrane Fouling and Energy Consumption in High-Pressure RO
Membrane fouling raises energy consumption in high-pressure RO systems by adding resistance at the membrane, which forces the pump to hold flow at higher pressure. Fouling adds hydraulic resistance and builds concentration polarization at the surface, so the same feed pressure now passes less water. How large the penalty grows depends on foulant type, recovery rate, and feed temperature.
Specific energy consumption (SEC) is measured in kilowatt-hours per cubic meter of permeate. That number climbs whenever the pump works harder to hold flow through a partly blocked membrane. For clean seawater RO, published figures commonly fall near 2.5 to 4 kWh/m³. The real value shifts with salinity, temperature, recovery rate, pump and energy-recovery efficiency, and whether pretreatment and post-treatment are counted.
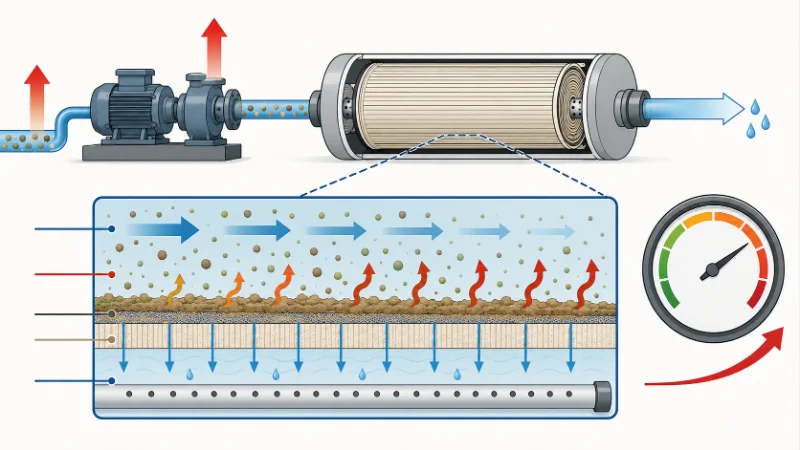
The mechanism is simple once you separate the variables. Fouling cuts permeate flow at a given pressure. To restore flow, operators raise feed pressure, and pump energy rises with it. We check the expected clean-membrane pressure and flux against the source water before we size the high-pressure RO pump. That way the design keeps enough margin to absorb normal fouling without running at its ceiling.
Fouling Types and Their Distinct Energy Signatures
Four fouling types dominate high-pressure RO: scaling, colloidal or particulate fouling, organic fouling, and biofouling. Each one changes pressure, flux, and energy demand in its own way, depending on feed water chemistry. Scaling comes from precipitating salts such as calcium carbonate and calcium sulfate. Colloidal and particulate fouling comes from suspended matter that slipped past pretreatment, organic fouling from dissolved natural organic matter, and biofouling from microbial growth on the surface. Knowing which mechanism is present matters, because the fix for scaling is not the fix for a biofilm.
We match the likely foulant profile to the feed analysis, so the pretreatment and cleaning plan targets the real mechanism instead of a generic one. The table below shows how each type tends to appear.
| Foulant type | Common trigger | Pressure / flux signature | Energy effect |
|---|---|---|---|
| Scaling (CaCO₃, CaSO₄) | High recovery, high scaling-index feed | Rising differential pressure in the last stage | Higher feed pressure to hold flow |
| Colloidal / particulate | Weak pretreatment, high silt density | Gradual flux decline across the array | Steady energy creep |
| Organic | High dissolved organic content | Flux decline with moderate pressure rise | Moderate, persistent penalty |
| Biofouling | Warm feed, biological activity | Sharp differential pressure rise in the lead stage | Large, fast-growing penalty |
Why Raising Feed Pressure Makes Fouling and Energy Worse
Raising feed pressure to restore flow on a fouling membrane is a short-term fix that usually makes the problem worse. Higher pressure compacts the fouling layer, adds to concentration polarization, and pushes specific energy consumption up. A compacted layer also makes later cleaning with a CIP cleaning system less effective, and it can push the system toward its design pressure limit. What looks like a quick win in output often ends as higher energy use, more frequent cleaning, and shorter membrane life.
In our experience with operator complaints about rising energy costs, the affected systems often share one habit. Someone raised feed pressure to chase a flow target instead of fixing the pretreatment gap behind the fouling. We build enough pressure margin and clear operating limits into each specification, so operators never have to run the pump past the point where fouling speeds up.
Feed Water Data We Review Before Estimating Fouling Risk
Fouling and energy risk in a high-pressure RO system can only be estimated from a full source water analysis. Each parameter points to a specific foulant mechanism and to the pressure the system will need. Before we confirm a design, our engineers review the parameters below against the feed and the target recovery.
| Parameter | Why it affects fouling and energy |
|---|---|
| TDS / conductivity | Sets osmotic pressure and baseline operating pressure |
| Temperature | Changes viscosity, flux, and interpretation of normalized data |
| pH / alkalinity / hardness | Drives calcium carbonate scaling risk |
| Ca²⁺, Mg²⁺, Ba²⁺, Sr²⁺, SO₄²⁻, SiO₂ | Drive carbonate, sulfate, and silica scaling risk |
| SDI / turbidity | Indicate colloidal and particulate fouling risk |
| TOC / COD | Indicate organic and biofouling risk |
| Iron, manganese, aluminum | Form deposits that foul the membrane |
| Free chlorine / ORP | Polyamide RO membranes are sensitive to free chlorine |
| Microbial indicators | Indicate biofilm risk |
Silt density index testing follows ASTM D4189. The scaling indices from these numbers set the safe recovery ceiling for a given feed. We treat this analysis as the starting point for every design. A system sized for the wrong feed will foul and waste energy in ways no operating tweak can fully undo.
Recovery Rate and Staging as a Fouling–Energy Trade-off
Recovery rate sets the balance between water output and fouling risk in high-pressure RO. Pushing recovery past what pretreatment and staging can support raises both scaling potential and energy consumption at once. Higher recovery concentrates salts in the reject stream. That raises scaling and concentration polarization near the membrane wall, and both add resistance the pump must overcome. A system can often run at higher recovery safely, but only if it was designed for that target and paired with solid pretreatment.
Splitting recovery across two or three stages can improve how energy is distributed in some designs. Whether it lowers energy for a given overall recovery depends on salinity, pump setup, inter-stage pressure drop, and the energy-recovery scheme, so confirm the split with membrane projection software rather than assume it. We compare recovery and staging options against the feed’s scaling indices before we fix the array. The goal is to hit the target output without running at the edge of the scaling limit.
Design Choices That Contain Energy Growth
Design decisions set how much fouling-driven energy penalty a high-pressure RO system can absorb before costs climb. The main levers are energy recovery devices, pump and drive selection, and membrane choice. Energy recovery devices capture pressure from the reject stream and pass it to the incoming feed, which lowers the load on the main pump. They pay off most on high-salinity, high-pressure jobs. Variable frequency drives let the pump match output to demand instead of running at a fixed point.
Membrane choice interacts with fouling too. RO membranes differ widely in permeability and fouling resistance. A low-energy membrane cuts power at clean conditions, but it can lose that edge if it runs at an aggressive flux, at low crossflow velocity, or on fouling-prone feed without enough pretreatment. We match the membrane, pump, and energy-recovery choice to the specific feed and site power, so the system holds its efficiency as fouling builds. Antiscalant type and dose sit upstream of these choices and depend on the same source water analysis. We set them as part of pretreatment design, not by copying another plant.
Diagnosing Fouling-Driven Energy Creep with Normalized Data
Normalized operating data, not raw pressure or flow readings, reveals fouling-driven energy creep early. Normalization strips out the effect of temperature and feed swings and exposes the real trend. Raw readings can hide a growing problem, because a warm feed can lift flux for a while even as fouling builds underneath. Standardizing performance data to fixed reference conditions, the practice in ASTM D4516, lets an operator compare today against startup on equal terms.
A small set of metrics carries most of the diagnostic signal:
- Recovery (%) = Permeate flow ÷ Feed flow × 100
- Differential ΔP = Feed pressure − Concentrate pressure
- Salt passage (%) = Permeate TDS ÷ Feed TDS × 100
- Salt rejection (%) = 100 − Salt passage
- SEC (kWh/m³) ≈ Pump power ÷ Permeate flow
For a system with energy recovery, SEC should count the main pump, any booster pump, the energy-recovery-device efficiency, and actual permeate flow. Feed pressure alone is not enough. Most membrane makers suggest looking at cleaning when normalized permeate flow drops by about 10–15%, normalized differential pressure rises about 10–15%, or normalized salt passage climbs noticeably. Check each threshold against the specific element’s manual, since too high a single-stage differential pressure can damage the elements.
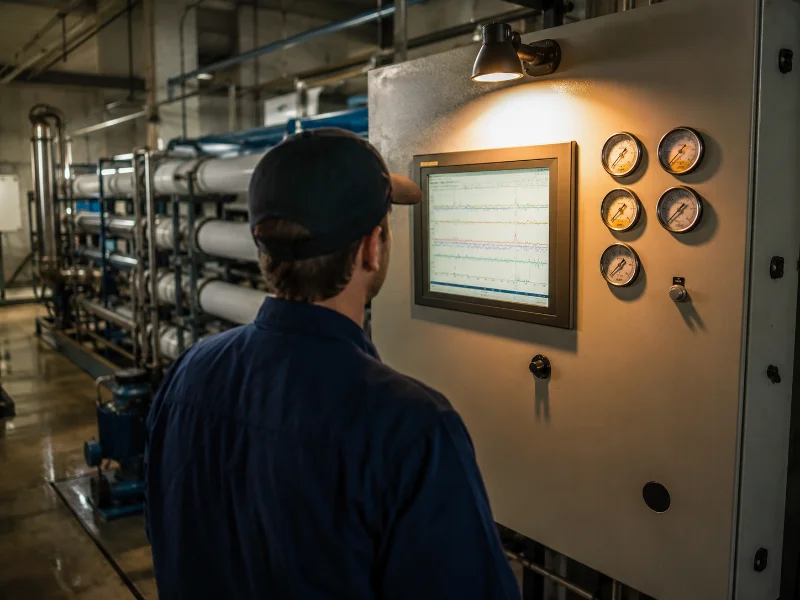
Consider a seawater desalination system that held 100 m³/h at 58 bar and now needs 63 bar for the same flow. Do not treat that 5 bar jump as a routine adjustment. Check it against normalized permeate flow, stage differential pressure, salt passage, feed temperature, and recovery. If normalized flow has dropped more than 10–15%, or normalized differential pressure has risen around 15%, evaluate the system for cleaning and pretreatment before raising feed pressure any further.
We build the instrument points needed to catch these trends into every system, so the data is there before a fouling problem turns into an energy problem. The exact cleaning chemistry, sequence, and dose for a given foulant belong to the element maker’s cleaning procedure, not to system selection. Match them to the foulant the data points to.
Conclusion
Three things decide the fouling and energy outcome in a high-pressure RO system: the foulant type in the feed, the recovery rate you ask it to reach, and the design margin built into the pump and energy recovery. Read them together instead of reacting to one pressure or flow number. That habit is what keeps energy cost in check as membranes age.
Our engineers work from your source water report to a membrane projection, confirm the flux and recovery targets, then choose the pump, staging, and energy-recovery setup to match. We fabricate and hydraulically pressure-test every system under our own engineering and QC oversight before it ships. The efficient operating point for a given plant still depends on project-level details, and those have to be confirmed against a real water analysis.
The most useful next step is to send us your source water report and application needs, whether you are specifying a single train or a full commercial RO machine line. Our engineers will review the fouling and energy profile for your feed and confirm a design matched to it.
FAQ
No single number applies, because the rise tracks the foulant type and how hard the system is pushed. A thin scale or biofilm that lifts stage differential pressure hurts far more than light colloidal fouling on a well-designed train. The honest figure for any given plant comes from its own normalized data, not from a rule of thumb.
Not always. Recovery only drives fouling and energy up when it passes what the pretreatment and array were built to handle. A system designed and pretreated for a high recovery target can hold it without a penalty. The trouble starts when someone raises recovery on a system that was never designed for it.
Only partly. An energy recovery device lowers the baseline energy a high-pressure system needs, but it does not erase the extra cost that fouling adds on top. On a high-salinity, high-pressure feed the device earns its place, yet the fouling still has to be solved at its source. Treating the device as a substitute for pretreatment leaves the energy penalty in place.
A slow rise in the feed pressure needed to hold the same flow is usually the first clue. Watch normalized permeate flow and differential pressure next, since they separate real fouling from a simple temperature change. By the time flow visibly drops at the outlet, the problem is already well along.
Only if the feed suits them. A low-energy membrane saves power in clean conditions, but a fouling-prone feed run at high flux can hand that saving straight back. The right pick depends on your source water and target recovery, not on the datasheet rating alone. Match the membrane to the feed first, then read the power numbers.